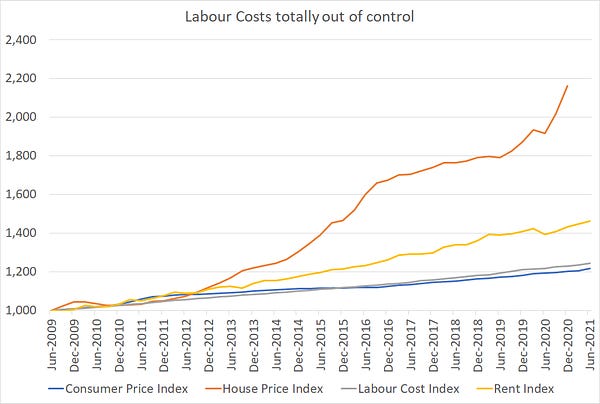
TLDR & TLDL: New Zealand’s increasingly isolated economic and financial community are almost unanimously convinced wage inflation is raging and the Reserve Bank needs to act urgently to tighten monetary policy dramatically and quickly.
All because wage inflation has risen to…2.1%…the same rate as it was a year ago. This group-think is worth challenging, especially when the same economists have been wrong for more than a decade with their warnings of imminent inflation that required rate hikes.

Stats NZ figures for June quarter employment and wages yesterday were the catalyst for a collective baying for rate hikes now to ‘get ahead’ of the inflation curve, pointing to what they see as the ‘lagging indicators’ of lower unemployment, rising jobs growth and rising wage inflation. Bank economists now expect the Reserve Bank to start hiking the official cash rate from 0.25% in two weeks time and continue tightening until it reaches 1.5% in mid-2022. That would lift shorter term mortgage rates from around 2% to 3.5-4% in short order.
BNZ even suggested a 50 basis point hike on August 18.
Here’s what the group is thinking
If you think I’m overstating the level of urgency and near-panic in the tone of the commentary, here’s a sample of the headlines for the notes used by the bank economists in alphabetical order, along with links to the notes and an extract of how they saw the data:
“Boiling point. Today’s data shows we’ve flown past full employment, and the economy is becoming quite overheated. The RBNZ needs to hike the OCR promptly to get on top of this.” ANZ’s note, which included a forecast of a 1.5% OCR by May next year.
‘Tighter than expected’: “As a consequence of the tight labour market, the rate of wage increases in the private sector has lifted sharply and by more than we expected. The labour market now looks to be at full capacity and this is generating strong wage inflation. Wage inflation (Labour Cost Index Private Sector Ordinary Time) lifted by more than expected, up 0.9% over the quarter to be up 2.2% over the year. This lift reflects the tightness of the labour market and will be the first of likely many moves higher over the coming year.” ASB’s note, which forecast a 1.0% OCR by year’s end.
‘Searing labour market data to hurry RBNZ rate hikes.’: “All the heat we’ve been hearing and warning about regarding New Zealand’s labour market, has been borne out in this morning’s data – including a clear pick-up in wage inflation. This surely removes any doubt about the RBNZ soon removing its foot from the accelerator.” BNZ’s note, which expected an OCR of 1.0% by November and a peak of 2.25% by early 2023, up from its previous view of a 2.0% peak.
‘Strap yourselves in for an RBNZ rate hike this month’: “The slack in the labour market has evaporated, and the underutilisation rate has fallen to 10.5% (a sticking point in the last report). Paid hours were up 8% over the year, which is a good indicator of economic growth.The gains in wages over the quarter were strong, as we expected, as firms try to attract workers (without access to migrants).” Kiwibank’s note, which saw the OCR at 1.5% by the end of 2022.
‘Demand red hot’. “Today’s results highlight the fact that current labour market conditions are as much a product of hot demand as they are of supply-side constraints. The closure of the international border has effectively cut off the flow of migrant workers, and we’ve increasingly been hearing stories about skill shortages and poaching of existing workers.” Westpac’s note, which forecast a rate hike in a fortnight and an OCR of 1.0% by the end of the year.
Here’s my heretical view
I think it’s worth challenging this local consensus view, which is well out of step with the views internationally on inflation, and which is looking increasingly like group-think. Part of the reason is the Reserve Bank of New Zealand, without any apparent internal debate or challenge from across the road in either Treasury or in Parliament, has stuck to its ‘over the horizon’ approach of inflation targeting which says it needs to act 18 months ahead of inflation to ‘get ahead of the curve’. That’s how the Reserve Bank has done since it ‘invented’ inflation targeting in the early 1990s.
However, that approach led to two premature rate hike cycles in the last decade and other central banks have pulled back from that ‘pre-emptive’ approach. The Reserve Bank of Australia, the US Federal Reserve and most recently the European Central Bank have adopted ‘average’ inflation targeting in the last two years. They have learned from those premature hikes, which they also carried out, and are waiting this time until they see the ‘whites of the eyes’ of inflation and in order to get ‘escape velocity’ from extremely low inflation that bedded in over the last decade. The US 10 year bond yield was at a five-month low of 1.21% this morning and is down from its inflation-panic high of 1.77% high in March. Since then, the delta variant waves and reassurance from the big central banks that they see the inflation as temporary has calmed markets.
Most central banks aim for around two percent inflation over the long run, and New Zealand is not much different. Our target range is 1-3% with a focus on the 2% midpoint, but actual inflation over the last decade has been largely closer to 1% than to 3%, which is what other central banks have seen too.
This chart below showing Treasury’s forecast of long term interest rates is typical of the forecasts of the Reserve Bank and the rest of the economic community, both here and overseas, over the last 20 years. They have consistently feared inflation more than they should have, which led to higher interest rates than would otherwise have been the case. Globalisation of manufacturing, the increasing mobility of workers between countries, the rise of the app economy driving down prices and the deunionisation of workforces in industrialised economies lowered wage inflation and goods inflation structurally. Economists missed those changes in their modelling, which they largely still use.

Just as a clock is right twice every day, it is possible economists are right this time and that something is different this time and wage inflation is about to take off. However, those same factors listed above are still in place, regardless of Covid. China’s factories are still there. The ships and containers have not evaporated. The app economy is stronger than ever and has only just gotten started on the services sector globally. The contractualisation of the workforce is continuing apace, thanks in part to the global platforms able to carve up work and wages and parcel it off around the world.
Is wage inflation really really taking off?
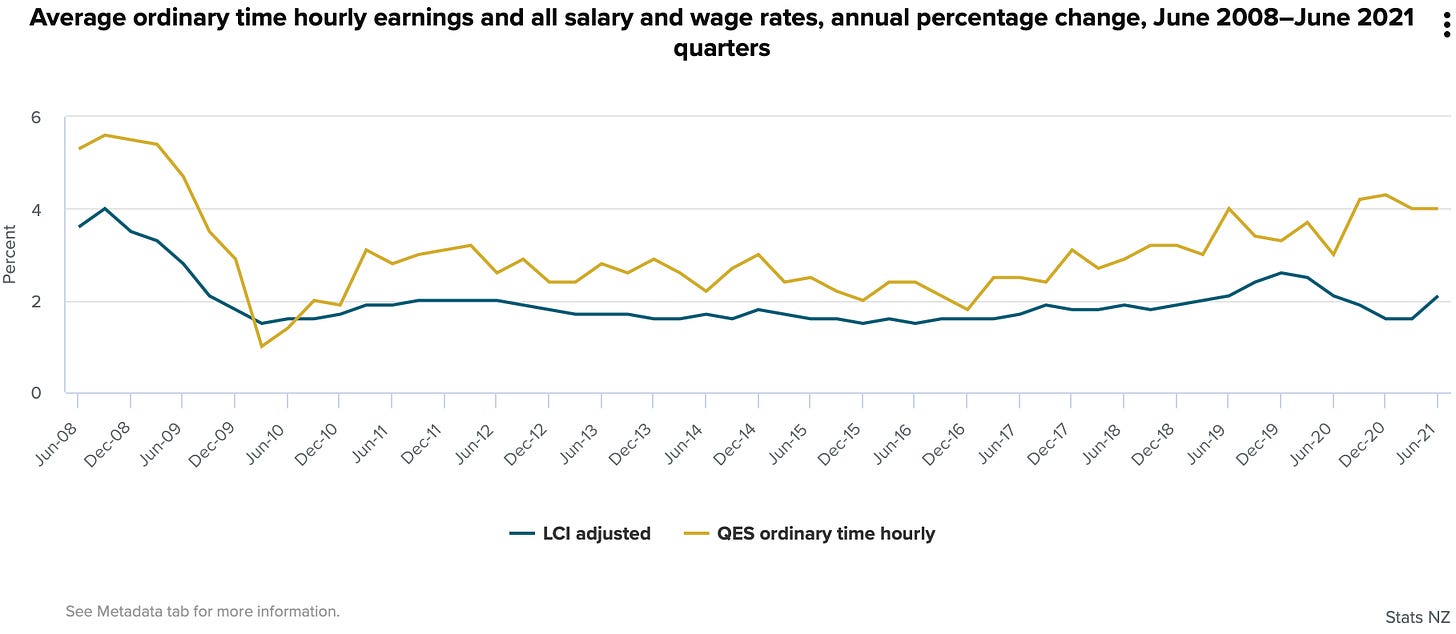
So it’s worth digging a little deeper into the wage inflation data in yesterday’s statistics to see what has spooked the country’s economists so much. The Labour Cost Index, which strips out the effects of promotions and skill changes, was 2.1% higher in the June quarter from the June quarter of 2020. That’s up from 1.6% in each of the December and March quarters, but only back to where it was in June 2020 and completely in line with the last 13 years of low wage inflation. Average ordinary time hourly earnings were up 4.0% from the same quarter a year ago and up 0.7% from the previous quarter. That wage inflation rate is also not out of line with what we’ve seen for the last couple of years, although slightly higher than the previous 10 years.
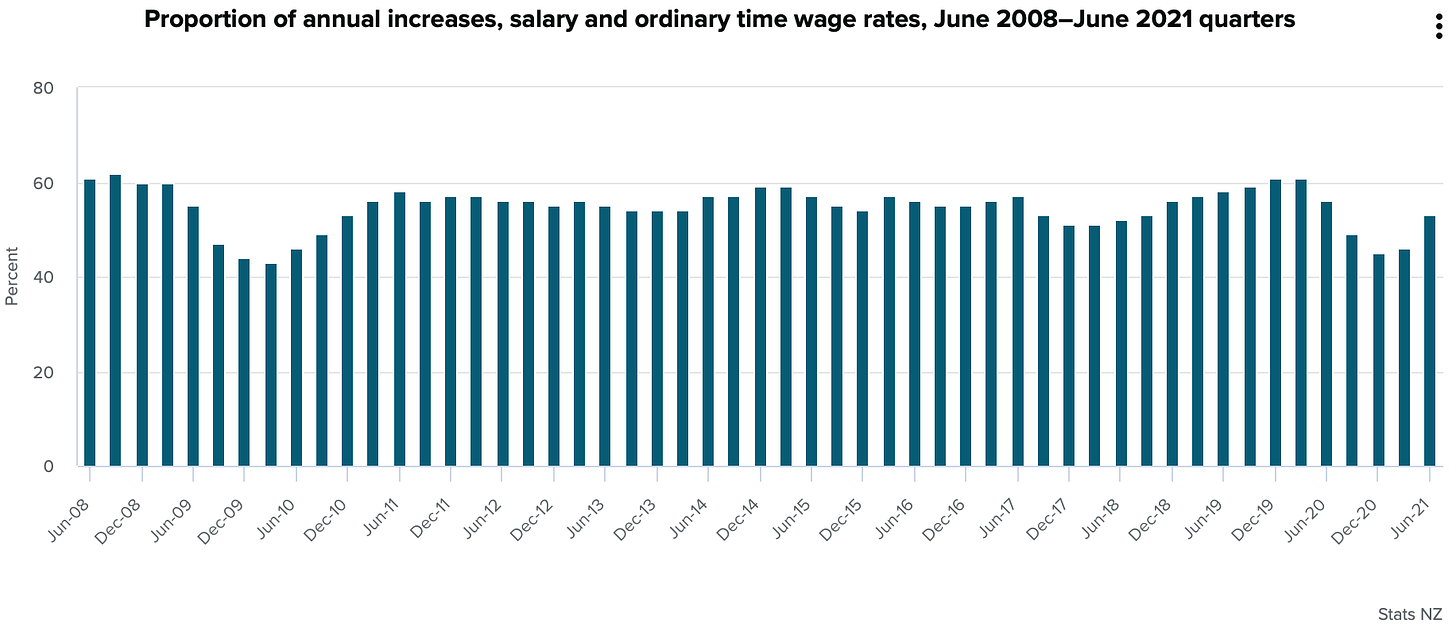
The proportion of workers reporting higher wage rates than a year ago was 53%, which was above the 46%, 45% and 49% seen the previous three quarters, but not out of line with 51-56% range seen for most of the past decade.
The percentage of workers reporting wage rate increases of over 3% did rise to 27% from 20% the previous quarter, but was also not out of line with the 26-30% seen in the year before Covid.
Is the uptick in the Covid recovery the sign of a major new inflation threat to come? Or another head-fake like the one we saw in the wake of the Global Financial Crisis in 2009 and again in 2014? The Reserve Bank hiked both times, and had to reverse them both times, often with extra cuts to reverse the damage.
But what about all the money printing?
The final point that many inflation-fearing commentators make is that surely all the recent money printing will catch fire and cause an inflation break out at some stage, and not just in asset prices.
It’s true the scale of the central bank money printing and bond buying is ginormous, as this chart showing the growth of the major central bank assets from Yardeni Research shows. Central banks have printed US$10t (the equivalent of about half of US GDP) in the last 15 months, having printed $14t in the previous 13 years.
If the cash being printed to buy longer term bonds had actually all then flowed out into the real economy in the form of investments in real and new business assets, jobs and consumer spending, then there would be an explosion of goods and services prices. But what actually has happened is more tragic in a way.
The banks and fund managers who received the freshly printed cash for their Government bonds have either parked it back in cash bank accounts with central and other banks, or in other ‘safe’ assets such as other Governments’ bonds or shorter term Government debt securities.
It’s being stashed in large electronic cash piles
Essentially, the cash has been stashed. It is either not circulating in the real economy, or has been used to buy existing cash-generating or ‘solid’ assets such as shares, houses, art, crypto-currencies (!) or slightly riskier corporate bonds. Either that money has sat there inert, or (stunningly) been handed back to shareholders as cash special dividends. It has then been stashed back on top of an ever-growing pile of cash. Think Scrooge McDuck, but with less gold and more accounts in Switzerland.
For example, the Swiss National Bank has had to print SFr43b (US$47b) in the last six months to sell to people wanting to stash their money in Swiss bank accounts. It’s using the freshly minted Swiss francs to buy US dollars and euros, which it has then used to buy bonds and shares overseas. The SNB’s asset pile just surpassed the SFr1t (US$1.1t) mark last week and it is now effectively one of the largest sovereign wealth funds in the world. It has printed 1.3 times Switzerland’s GDP. That’s one way to get rich, but it’s not really filtering out yet into the real economy globally.
Why isn’t it being spent or invested properly?
The economic theory is that eventually investors and savers will recover their confidence and start putting money into real and new factories and products and people so that the money starts circulating more widely, and more quickly. But one of the larger problems we’ve seen in the last decade is that an increasing concentration of wealth among the wealthiest and oldest is just not circulating. The first priority of the very, very wealthy is to preserve that wealth for the next generation by buying safe and already-existing assets. Their collective appetites for risky investments decline as they get richer and richer, which creates a feedback loop making the cash piles larger and larger, and the money circulatory speed slower and slower.
Here’s one measure of those short term cash piles, as measured by the US Federal Reserve’s holdings of reverse repos.
Here’s a chart showing how the speed of money circulation has been falling since 2000 and slumped sharply after the GFC as inequality started to widen dramatically.
This chart shows what has happened to the US money supply’s speed of circulation since the late 1950s. The M2 money supply circulation rate rose from 1.8 times a year to 2.2 during the late 1980s and early 1990s as the boomers were in their prime spending and household formation years. It then sank sharply after the GFC and Covid as the holders of wealth stashed it and sat on it. It is now around 1.1 times circulation each year.
That’s my broad view on why wage inflation and overall goods and services prices inflation has yet to take off globally in a substantive way, beyond the short-term and base comparison effects of prices bouncing from Covid lockdown lows or because of specific short-term logistics and labour supply issues.
The world hasn’t changed that much
Remember, the drivers of deflation or at least disinflation have not gone away because of Covid. In summary, they include:
globalisation of goods manufacturing;
the app economy’s ongoing disruption of services sectors;
the contractualisation and globalisation of labour forces; and
widening inquality concentrating assets in the hands of those unable or unwilling to spend or invest it.
But this time is different? Yeah, right.
Why is New Zealand’s financial community so certain they are right about inflation and wages this time around, when they were wrong for the last decade, and when the rest of the world’s economic community is waiting for confirmation before their central banks pull their rates trigger?
I think it’s partly because of the shock of what has happened to asset prices generally and house prices in New Zealand in particular. It feels so out of whack and loony tunes that there is a desperation to ‘get back to normality’ and to take away some of the low-interest-rate fire under the market. That’s understandable, but hiking interest rates is not the way to do it.
Making housing affordable is the Government’s task. It needs to change the underlying supply and demand drivers, including removing the tax advantages, massively ramping up local infrastructure funding and spending, and actively resetting expectations about prices and rents. To do that, it needs to convince median voters that higher tax rates and wealth taxes on them in particular are needed to fund the infrastructure and new housing supply.
My view: Using panicky rate hikes is not the way to solve our housing affordability problem.
Scoops and news breaking this morning


Signs o’ the times news


Chart of the day


A fun thing
Ka kite anō
Bernard


Share this post